MAP/USDT SPECIAL ACCELERATION – BREAKING RESISTANCE, CONFIRMING MAPNODE'S STRENGTH

The market is in turmoil as MAP/USDT continues to record an impressive price increase, surpassing the 0.075 USDT mark and increasing by more than 8.4% in just 24 hours. This breakout not only demonstrates the technical strength of MAP but also reflects the strong confidence of the investor community in the MapNode ecosystem.
The daily trading volume has exceeded 705,000 USDT, showing that money is pouring into the market. Technical indicators, including the short-term and long-term MA lines, are showing positive signals, as the uptrend is being strongly consolidated. In particular, the recent strong bullish candle broke the important resistance zone at 0.074 USDT, opening up the opportunity to form a new higher price zone in the short term.
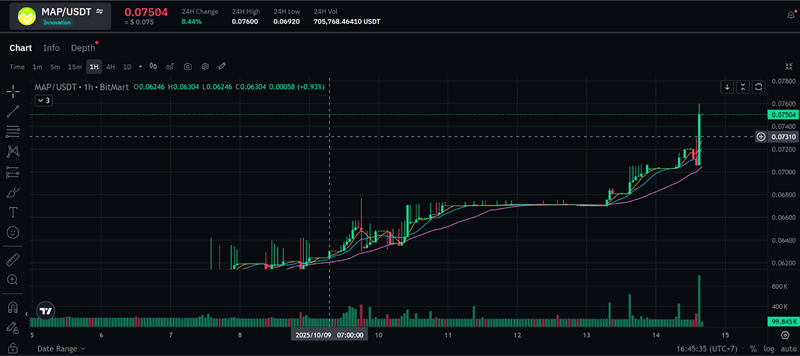
Price Analysis | 1H Chart
The heat of MAP comes not only from the price chart but also from the rapid development of the MapNode ecosystem, with products that are making their mark on the market such as MapSwap, MapWallet, MapCex and MapMarketCap. This contributes to strengthening the belief that the current uptrend of MAP has a solid foundation, not just short-term.
According to analysis from experts, if MAP continues to maintain above the threshold of 0.075 USDT, the next target can completely expand to the 0.085 - 0.1 USDT zone, especially in the context that MapNode is approaching the turning point of listing on the world's leading exchanges.
The community is asking:
Is this the start of MAP’s strongest growth cycle ever?
And will this breakthrough be the lever to help MAP reach new heights in the international market?
One thing is certain – MapNode is entering a breakthrough growth phase, where the project’s internal strength and community trust merge into one, creating an unstoppable development journey.
Connect here
Website: https://mapnode.io/
Website: https://mapscan.tech/
Website: https://mapmarketcap.com/
Website: https://mapcex.com/
Youtube: https://www.youtube.com/channel/UCeX6536YDGDI54ghkMrkHzA/videos
Telegram Community: https://t.me/mapnodecommunity